What Is a P&L Diagram?
A profit-and-loss diagram (also called a payoff diagram) is a visual chart that shows how much money you would make or lose at expiration for every possible price of the underlying asset. It is one of the most important tools in options trading because it lets you see the full risk and reward profile of a strategy at a glance, before you enter the trade.
Ainvest's Strategy Builder generates a P&L diagram for every strategy template automatically. Understanding how to read this chart is essential to making informed decisions.
Anatomy of the Chart
Axes
- X-axis (horizontal): The underlying asset's price. For example, if you are looking at SPY options, the X-axis might range from $660 to $810. The range adjusts based on the strategy and strike prices you select.
- Y-axis (vertical): Profit or loss in dollars. Positive values (above zero) represent profit. Negative values (below zero) represent loss. For example, the scale might range from -$3,000 to +$15,000.
Color Zones
- Green shaded area: The price range where the strategy is profitable. Any underlying price that falls within the green zone at expiration results in a net gain.
- Red shaded area: The price range where the strategy loses money. Any underlying price in the red zone at expiration results in a net loss.
Key Markers
- Breakeven line: The point (or points) where the P&L curve crosses the zero line. At these prices, you neither make nor lose money. Some strategies have one breakeven point; others have two.
- Current price marker: A vertical dashed line shows where the underlying asset is trading right now. This lets you immediately see whether the current price is in the profit zone, loss zone, or near a breakeven point.
Data Fields Below the Chart
Beneath the P&L diagram, the Strategy Builder displays a row of key metrics:
- Underlying Price: The current market price of the stock or ETF. This corresponds to the vertical dashed line on the chart.
- Max Profit: The best-case scenario profit for the strategy. For uncapped strategies like a Long Call, this displays an infinity symbol because the underlying can theoretically rise without limit. For defined-risk strategies, it shows a specific dollar amount.
- Max Loss: The worst-case scenario loss, shown in red. For example, "$-223.00" means you could lose up to $223 on the position. For strategies with unlimited risk (such as a Short Call), this field will reflect that the loss is uncapped.
- Breakeven: The price (or prices) at which the strategy breaks even. Strategies with two breakeven points will show both values.
- Lot Size: The number of shares per options contract. The standard lot size is 100, meaning each contract controls 100 shares of the underlying asset.
- Delta, Gamma, Theta, Vega, Rho: The combined Greeks for the strategy. These measure the position's sensitivity to price movement, time decay, volatility changes, and interest rate changes. See Understanding the Greeks for detailed explanations.
Reading Different Strategy Shapes
The shape of the P&L curve tells you what type of strategy you are looking at:
Directional Bullish (Single Line Going Up-Right)
Strategies like Long Call and Short Put show a line that rises from the lower left to the upper right. The slope reflects the position's delta. The steeper the line, the more sensitive the position is to price changes.
Directional Bearish (Single Line Going Down-Right)
Strategies like Long Put and Short Call show a line that falls from the upper left to the lower right. Profit increases as the underlying price decreases.
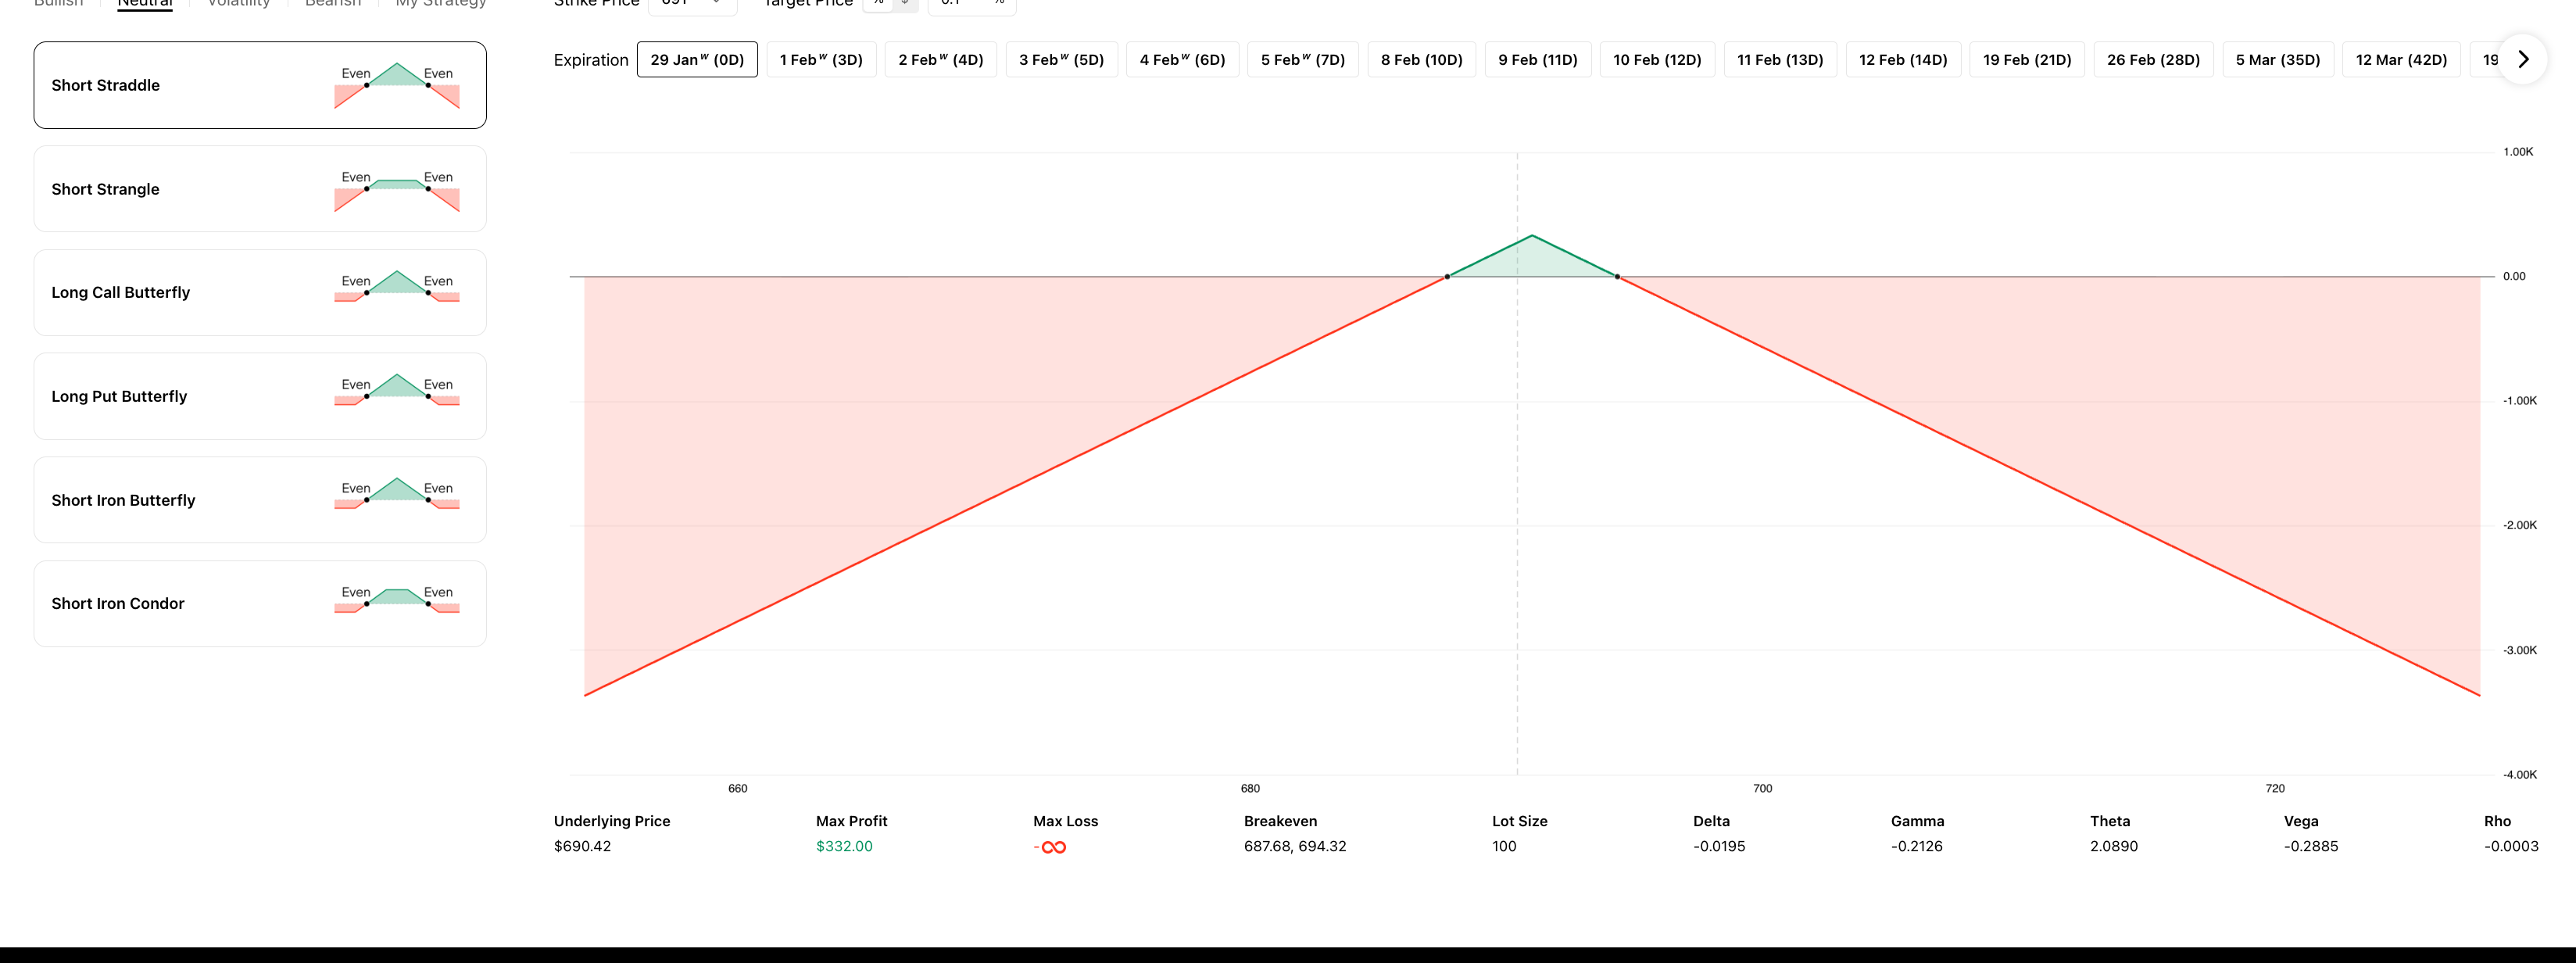
Neutral / Range-Bound (Tent or Mountain Shape)
Butterfly and condor strategies display a tent or mountain shape. The peak of the tent represents maximum profit, which occurs when the underlying stays near the center of the range. Losses are on both edges. For condors, the top is flat (a plateau), reflecting the wider profit zone.
Volatility (V or Valley Shape)
Long Straddles and Long Strangles display a V or valley shape. The lowest point represents maximum loss (at or near the strike price), and profit increases as the underlying moves further in either direction. This is the inverse of the neutral tent shape.
Spread (Capped Flat Sections)
Vertical spreads (Bull Call Spread, Bear Put Spread, etc.) show a line that transitions between two flat sections. Both the maximum profit and maximum loss are limited, creating a staircase-like profile. The flat sections make it immediately clear that risk and reward are both defined.
Tips for Using P&L Diagrams
- Steepness equals sensitivity. The steeper the slope of the P&L line, the more the position's value changes for each dollar move in the underlying. Steep slopes correspond to higher delta values.
- Compare Max Loss to your account size. Before entering any trade, check the Max Loss field and make sure it represents a risk level you are comfortable with relative to your total account value.
- Use the expiration selector. Switch between different expiration dates to see how the P&L curve changes across timeframes. Closer expirations produce more extreme shapes -- steeper slopes and tighter breakeven points. Longer expirations are smoother and give the trade more time to work.
- Watch for asymmetry. Some strategies have asymmetric P&L profiles -- for example, a Long Call has limited loss but unlimited profit. Others, like a Short Straddle, have limited profit but unlimited loss. The diagram makes these asymmetries immediately visible.
Try it on Ainvest: Open the Strategy Builder to see P&L diagrams in action.