What Is the Strategy Builder?
The Strategy Builder is an interactive tool on Ainvest that lets you model multi-leg options strategies with visual profit-and-loss (P&L) diagrams and a full Greeks display. You can select a strategy template, configure strike prices and expiration dates, and instantly see the projected P&L curve, breakeven points, maximum profit, maximum loss, and all relevant Greeks for the combined position.
Whether you are evaluating a simple long call or a multi-leg iron condor, the Strategy Builder gives you a clear picture of the risk and reward before you commit any capital.
Where to Find It
- Web: The Strategy Builder is available on the Option Ticker Page as the "Strategy Builder" tab alongside Option Chain and Volatility. It is also accessible from the general ticker page options tab (for example, ETF Options Page).
- Mobile: The Strategy Builder is not available on mobile. It is a web-only feature.
How It Works
Strategy Categories
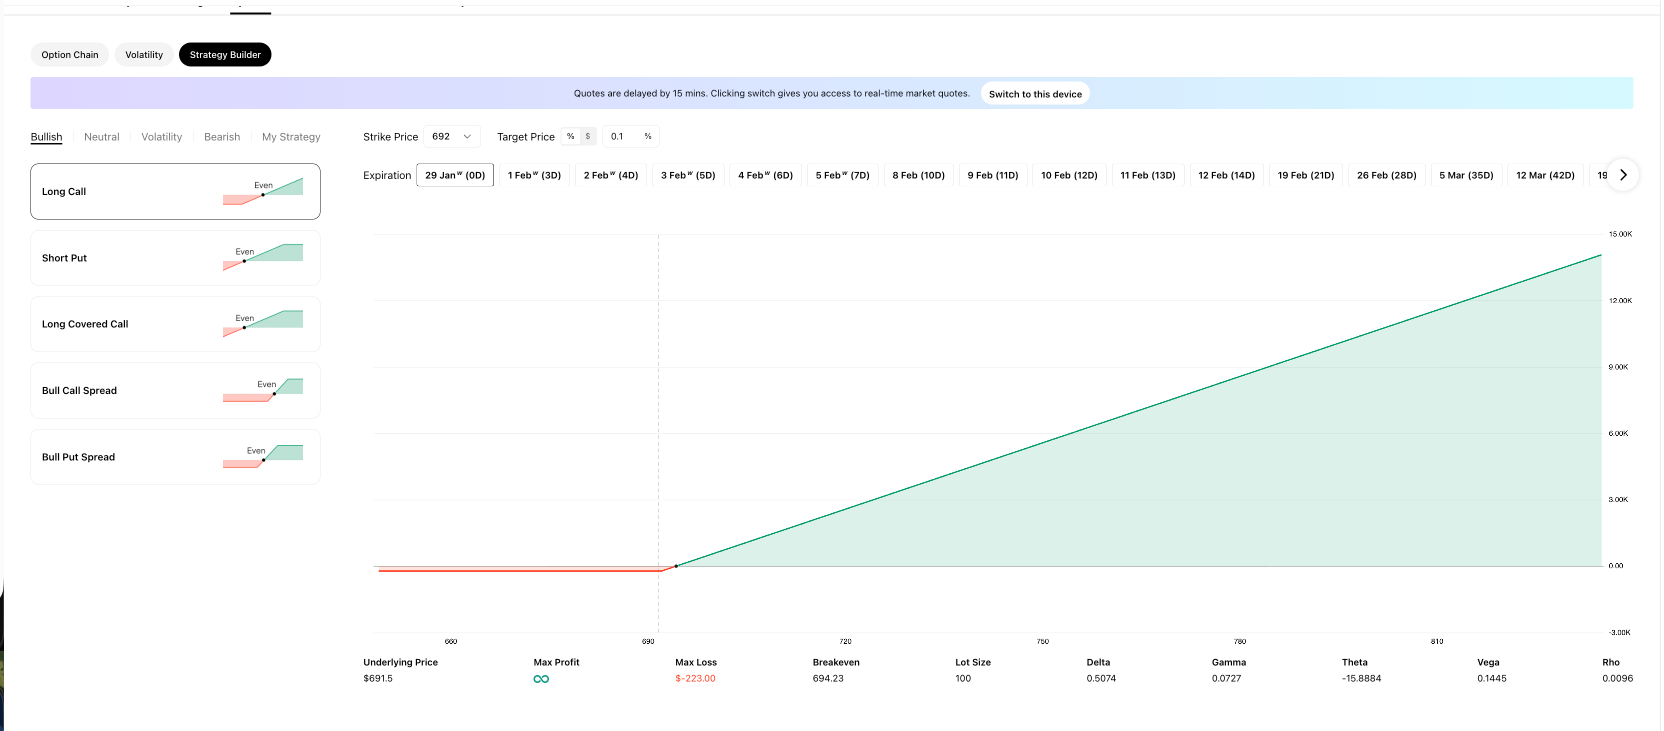
Across the top of the Strategy Builder you will find five category tabs:
| Tab | Purpose |
|---|---|
| Bullish | Strategies that profit when the underlying rises |
| Neutral | Strategies that profit when the underlying stays in a range |
| Volatility | Strategies that profit from large moves in either direction |
| Bearish | Strategies that profit when the underlying falls |
| My Strategy | Your saved custom configurations for quick access |
Each category lists pre-built strategy templates. Every template includes a small P&L diagram preview that shows the profit/loss shape and breakeven point(s) at a glance. Click any strategy to load it into the main chart area.
Configuration Controls
Once a strategy is loaded, you can adjust three controls:
- Strike Price -- Use the dropdown to select the strike price (for example, 692).
- Target Price -- Set a hypothetical future price for the underlying using a percentage or dollar toggle (for example, 0.1%). The P&L diagram will display a marker at this price level, showing you the projected profit or loss if the underlying reaches your target. This is a visualization tool only — it does not place an order or affect execution.
- Expiration -- A horizontal scrollable date selector shows available expiration dates along with the days-to-expiration count (for example, "29 Jan (0D)", "1 Feb (3D)", "2 Feb (4D)").
Main Display Area
The central area of the Strategy Builder contains a large P&L diagram:
- The X-axis represents the underlying asset price.
- The Y-axis represents profit or loss in dollars.
- Green shaded area marks the price range where the strategy is profitable.
- Red shaded area marks the price range where the strategy loses money.
- A vertical dashed line indicates the current price of the underlying asset.
Data Fields Below the Chart
Beneath the P&L diagram, the Strategy Builder displays a row of key metrics:
- Underlying Price -- The current market price of the stock or ETF.
- Max Profit -- The best-case profit. Displays "infinite" for uncapped strategies such as a Long Call.
- Max Loss -- The worst-case loss, shown in red (for example, $-223.00).
- Breakeven -- The price point(s) at which the strategy neither makes nor loses money.
- Lot Size -- The number of shares per contract (typically 100).
- Delta, Gamma, Theta, Vega, Rho -- The combined Greeks for the entire strategy position.
My Strategy Tab
The "My Strategy" tab lets you save custom strategy configurations so you can return to them quickly without rebuilding from scratch.
Try it on Ainvest: Open the Strategy Builder to model this strategy with live market data.
Next Steps
Explore each strategy category and supporting educational articles:
- Bullish Strategies
- Bearish Strategies
- Neutral Strategies
- Volatility Strategies
- How to Read P&L Diagrams
- Understanding the Greeks in the Strategy Builder
For foundational options concepts, see: