What Are Bullish Strategies?
Bullish strategies are options positions designed to profit when the underlying asset's price increases. They range from simple, single-leg trades to multi-leg spreads that cap both risk and reward. Ainvest's Strategy Builder offers five bullish templates, each with its own risk/reward profile and ideal market conditions.
Where to Find Them
- Web only: Navigate to the Option Ticker Page or the general ticker options tab, select the Strategy Builder tab, then click the Bullish tab.
- The Strategy Builder is not available on mobile.
1. Long Call
Definition
A Long Call is the most straightforward bullish strategy. You buy a call option at a chosen strike price, giving you the right to purchase the underlying asset at that strike before expiration.
When to Use
Use a Long Call when you expect the stock to rise significantly above the strike price before the option expires. This is a directional bet with unlimited upside.
Risk and Reward
- Max Profit: Unlimited. Because the underlying price can rise indefinitely, there is no cap on potential gains.
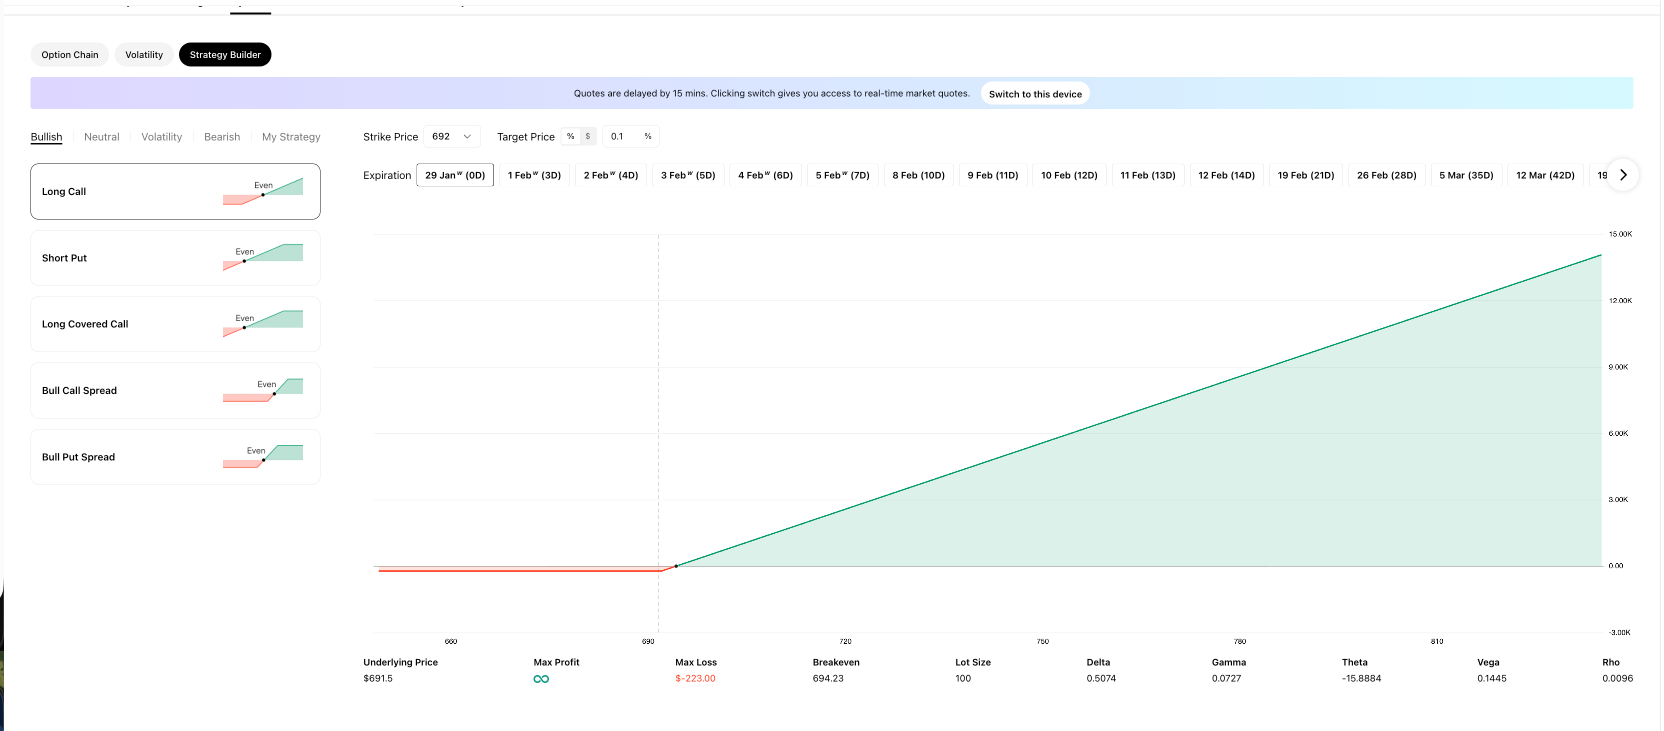
- Max Loss: Limited to the premium paid. For example, if the Strategy Builder shows a max loss of $-223.00, that is the total amount at risk.
- Breakeven: Strike price plus the premium paid (for example, 694.23).
P&L Diagram
In Ainvest's Strategy Builder, the Long Call diagram shows a red-shaded loss zone to the left of the breakeven point and a green-shaded profit zone that rises linearly to the right. The slope of the profit line reflects the position's delta.
Greeks Context
- Delta: Positive (approximately 0.50 for an at-the-money call). The position profits from upward price movement.
- Gamma: Positive. Delta increases as the stock rises, accelerating gains.
- Theta: Negative. Time decay works against you every day you hold the position.
- Vega: Positive. Rising implied volatility increases the option's value.
2. Short Put
Definition
A Short Put involves selling a put option. You collect the premium upfront and take on the obligation to buy the underlying asset at the strike price if the option is assigned.
When to Use
Use a Short Put when you expect the stock to stay at or rise above the strike price and you want to collect premium income. This strategy can also be used as a way to acquire shares at a lower effective cost basis.
Risk and Reward
- Max Profit: Limited to the premium received.
- Max Loss: Substantial. If the stock drops to zero, your loss equals the strike price minus the premium received (multiplied by the lot size).
- Breakeven: Strike price minus the premium received.
P&L Diagram
The diagram shows a green profit zone above the breakeven point and a red loss zone that accelerates downward as the underlying price falls. The profit section is flat (capped at the premium), while the loss section slopes steeply.
Key Risk
You are obligated to buy 100 shares at the strike price if the option is assigned. Make sure you have the capital or margin to cover this obligation. This strategy is also known as a cash-secured put because your broker typically requires you to hold cash equal to the strike price multiplied by 100 in reserve.
Early assignment risk: If the underlying stock pays a dividend, you may be assigned early — especially when the put is deep in the money near the ex-dividend date. Be aware of upcoming dividend dates when selling puts on dividend-paying stocks.
3. Covered Call
Definition
A Covered Call combines owning 100 shares of the underlying asset with selling a call option against those shares. The short call generates income but caps your upside.
When to Use
Use a Covered Call when you already own shares, have a mildly bullish outlook, and are willing to sell your shares at the strike price. This is one of the most popular income-generating strategies among retail investors.
Risk and Reward
- Max Profit: Limited. Capped at the strike price minus your stock purchase price plus the premium received from the call.
- Max Loss: If the stock falls to zero, the loss equals your stock purchase price minus the premium received.
- Breakeven: Stock purchase price minus the premium received.
P&L Diagram
The Strategy Builder shows a line that rises from the lower left, passes through the breakeven point into the green profit zone, and then flattens out at the maximum profit level. The flat section reflects the cap imposed by the short call.
4. Bull Call Spread
Definition
A Bull Call Spread involves buying a call at a lower strike price and selling a call at a higher strike price, both with the same expiration date. This creates a defined-risk, defined-reward position.
When to Use
Use a Bull Call Spread when you are moderately bullish and want to reduce the cost of entering a long call position. The premium received from the short call partially offsets the premium paid for the long call.
Risk and Reward
- Max Profit: The difference between the two strike prices minus the net premium paid.
- Max Loss: The net premium paid.
- Breakeven: Lower strike price plus the net premium paid.
P&L Diagram
The diagram shows a red loss zone below the lower strike, a rising line through the breakeven point, and a flat green profit zone above the upper strike. Both the profit and loss sections are capped, creating a "staircase" shape.
5. Bull Put Spread
Definition
A Bull Put Spread involves selling a put at a higher strike price and buying a put at a lower strike price, both with the same expiration date. You collect a net credit when entering the trade.
When to Use
Use a Bull Put Spread when you are moderately bullish and want to collect premium income with defined risk. This is a popular strategy for traders who prefer credit spreads.
Risk and Reward
- Max Profit: The net premium received.
- Max Loss: The difference between the two strike prices minus the net premium received.
- Breakeven: Higher strike price minus the net premium received.
P&L Diagram
The diagram shows a flat green profit zone above the higher strike, a declining line between the two strikes, and a flat red loss zone below the lower strike. Like the Bull Call Spread, both sides are capped.
How the Strategy Builder Visualizes Bullish Strategies
For every bullish strategy, the Strategy Builder uses consistent visual conventions:
- Green shading marks the price range where the strategy produces a profit.
- Red shading marks the price range where the strategy produces a loss.
- Breakeven is the point where the P&L curve crosses the zero line.
- The vertical dashed line shows the current underlying price, letting you see at a glance whether the stock is currently in the profit or loss zone.
Use the expiration date selector to see how the P&L profile changes across different timeframes, and review the Greeks row below the chart to understand the position's sensitivity to price, time, and volatility.
Try it on Ainvest: Open the Strategy Builder to model bullish strategies with live data.