What Are Volatility Strategies?
Volatility strategies are options positions designed to profit from large price movements in either direction. These strategies are used when you expect high volatility -- for example, ahead of earnings announcements, economic data releases, or other market-moving events -- but are uncertain about the direction the underlying will move.
Volatility strategies are the mirror image of neutral strategies. Where neutral strategies profit from stillness, volatility strategies profit from motion.
Ainvest's Strategy Builder offers six volatility templates.
Where to Find Them
- Web only: Navigate to the Option Ticker Page or the general ticker options tab, select the Strategy Builder tab, then click the Volatility tab.
- The Strategy Builder is not available on mobile.
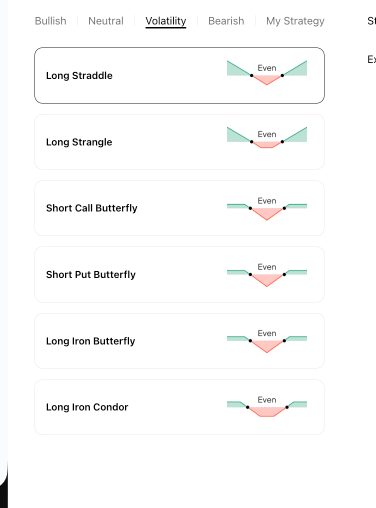
1. Long Straddle
Definition
A Long Straddle involves buying a call and a put at the same strike price with the same expiration date. You pay two premiums upfront and profit if the underlying makes a large move in either direction.
When to Use
Use a Long Straddle when you expect a significant price move but do not know which direction it will go. Common scenarios include trading ahead of earnings reports, FDA decisions, or major economic announcements.
Risk and Reward
- Max Profit: Unlimited to the upside (the call side) and substantial to the downside (the put side, limited only by the stock reaching zero).
- Max Loss: Limited to the total premium paid for both options. Maximum loss occurs if the underlying closes exactly at the strike price at expiration.
- Breakeven: Two breakeven points -- the strike price plus the total premium (upper) and the strike price minus the total premium (lower).
P&L Diagram
The Strategy Builder displays a "V" shape. The bottom of the V sits at the strike price in the red loss zone. Green profit zones extend in both directions from the breakeven points. The deeper the V, the higher the combined premium and the larger the move needed to profit.
2. Long Strangle
Definition
A Long Strangle involves buying an out-of-the-money (OTM) call and an OTM put at different strike prices with the same expiration date.
When to Use
Use a Long Strangle under the same conditions as a Long Straddle -- when you expect a big move but are unsure of direction. The Long Strangle costs less than a Long Straddle because both options are OTM, but it requires a larger price move to become profitable.
Risk and Reward
- Max Profit: Unlimited to the upside and substantial to the downside.
- Max Loss: Limited to the total premium paid. Maximum loss occurs if the underlying closes between the two strike prices at expiration.
- Breakeven: Two points -- the call strike plus the total premium (upper) and the put strike minus the total premium (lower). The breakeven points are wider apart than in a Long Straddle.
P&L Diagram
The diagram shows a wider "V" shape (or more accurately, a "U" shape with a flat bottom between the two strikes). The flat red section in the middle represents the range where maximum loss occurs. Green profit zones extend beyond the breakeven points on both sides.
3. Short Call Butterfly
Definition
A Short Call Butterfly is the opposite of the Long Call Butterfly found in the Neutral tab. It involves selling one call at a lower strike, buying two calls at a middle strike, and selling one call at a higher strike.
When to Use
Use a Short Call Butterfly when you expect the underlying to move significantly away from the middle strike price. This strategy profits from volatility while maintaining defined risk.
Risk and Reward
- Max Profit: Limited. Achieved if the underlying closes below the lower strike or above the higher strike. The profit equals the net premium received.
- Max Loss: Limited. Maximum loss occurs if the underlying closes exactly at the middle strike. The loss equals the difference between the lower and middle strikes minus the net premium received.
- Breakeven: Two points, calculated symmetrically around the middle strike.
P&L Diagram
The Strategy Builder shows an inverted tent or valley shape -- the opposite of the neutral Long Call Butterfly. The lowest point (maximum loss) is at the middle strike in a red zone. Green profit zones are flat on both sides beyond the breakeven points.
4. Short Put Butterfly
Definition
A Short Put Butterfly follows the same logic as the Short Call Butterfly but uses put options: sell one put at a higher strike, buy two puts at a middle strike, and sell one put at a lower strike.
When to Use
Use a Short Put Butterfly under the same conditions as a Short Call Butterfly. The expiration P&L profile is nearly identical.
Risk and Reward
- Max Profit: Limited. Achieved when the underlying moves far from the middle strike.
- Max Loss: Limited. Occurs at the middle strike.
- Breakeven: Two points around the middle strike.
P&L Diagram
The diagram mirrors the Short Call Butterfly -- a valley shape with the deepest loss at the center and flat profit zones on both edges.
5. Long Iron Butterfly
Definition
A Long Iron Butterfly involves buying an at-the-money (ATM) straddle and selling an OTM strangle for protection. Specifically: buy an ATM call, buy an ATM put, sell an OTM call above, and sell an OTM put below. This is the defined-risk version of a Long Straddle.
When to Use
Use a Long Iron Butterfly when you want exposure to volatility but need to cap your maximum loss. The sold wings reduce the net cost of the position compared to a naked Long Straddle, but they also cap your maximum profit.
Risk and Reward
- Max Profit: Limited. Achieved when the underlying moves to either short strike. The profit equals the distance between the ATM strike and either OTM strike minus the net premium paid.
- Max Loss: Limited to the net premium paid. Occurs if the underlying closes at the ATM strike at expiration.
- Breakeven: Two points -- the ATM strike plus the net premium (upper) and the ATM strike minus the net premium (lower).
P&L Diagram
The diagram shows a valley shape similar to the Short Call Butterfly but constructed differently. The red zone sits at the center (ATM strike), and the green profit zones are capped (flat) on both sides at the level of the short strikes.
6. Long Iron Condor
Definition
A Long Iron Condor involves buying an OTM put spread and buying an OTM call spread. Specifically: buy an OTM put at a higher strike, sell an OTM put at a lower strike, buy an OTM call at a lower strike, and sell an OTM call at a higher strike. This is the defined-risk version of a Long Strangle.
When to Use
Use a Long Iron Condor when you expect a large move in either direction and want defined risk on both sides. This strategy has a wider loss zone in the middle but capped risk.
Risk and Reward
- Max Profit: Limited. Achieved when the underlying moves beyond either outer strike.
- Max Loss: Limited to the net premium paid. Occurs if the underlying stays between the two inner strikes.
- Breakeven: Two points based on the inner strikes and the net premium.
P&L Diagram
The Strategy Builder shows a wide valley with a flat bottom (the loss zone between the inner strikes) and flat profit zones on both sides (capped at the outer strikes). This shape is the inverse of the neutral Short Iron Condor.
Volatility vs. Neutral: Inverse Relationships
Every volatility strategy in this tab has a counterpart in the Neutral tab. The P&L diagrams are inversions of each other:
| Volatility Strategy | Neutral Counterpart |
|---|---|
| Long Straddle | Short Straddle |
| Long Strangle | Short Strangle |
| Short Call Butterfly | Long Call Butterfly |
| Short Put Butterfly | Long Put Butterfly |
| Long Iron Butterfly | Short Iron Butterfly |
| Long Iron Condor | Short Iron Condor |
Understanding this relationship makes it easier to evaluate which side of the trade you want to be on based on your market outlook.
Tips for Trading Volatility Strategies
- Enter Long Straddles and Long Strangles before the expected volatility event, not after. Implied volatility tends to rise into the event and collapse afterward (known as "IV crush").
- Check the Vega value in the Strategy Builder. A high positive Vega means the position benefits from rising implied volatility.
- Use the expiration date selector to compare shorter and longer timeframes. Shorter expirations are cheaper but require the move to happen faster.
- Compare the combined premium cost to the expected magnitude of the move. If the stock needs to move 10% to break even but the average earnings move is 5%, the strategy may not be favorable.
Try it on Ainvest: Open the Strategy Builder to model volatility strategies with live data.