The Options Overview Page at https://www.ainvest.com/options/ serves as the main options dashboard on the Ainvest web platform. It aggregates multiple tools into a single scrollable view, giving you a market-wide snapshot of options activity without needing to navigate between separate pages.
This article walks through each section of the page from top to bottom.
Page Layout
The page is organized into four main sections stacked vertically:
- Flows Monitor (top) -- Real-time call/put volume chart with index ETF sidebar
- Option Lab (middle) -- Curated editorial content including daily flow digests and news
- 0DTE Rankings -- Zero-days-to-expiration options ranked by price change
- Options Rankings (bottom) -- Broader options rankings by volume, open interest, and Vol/OI
Each section can be viewed independently, but together they provide a comprehensive picture of the day's options landscape.
Flows Monitor
The Flows Monitor occupies the top of the page and is the first thing you see when the page loads.
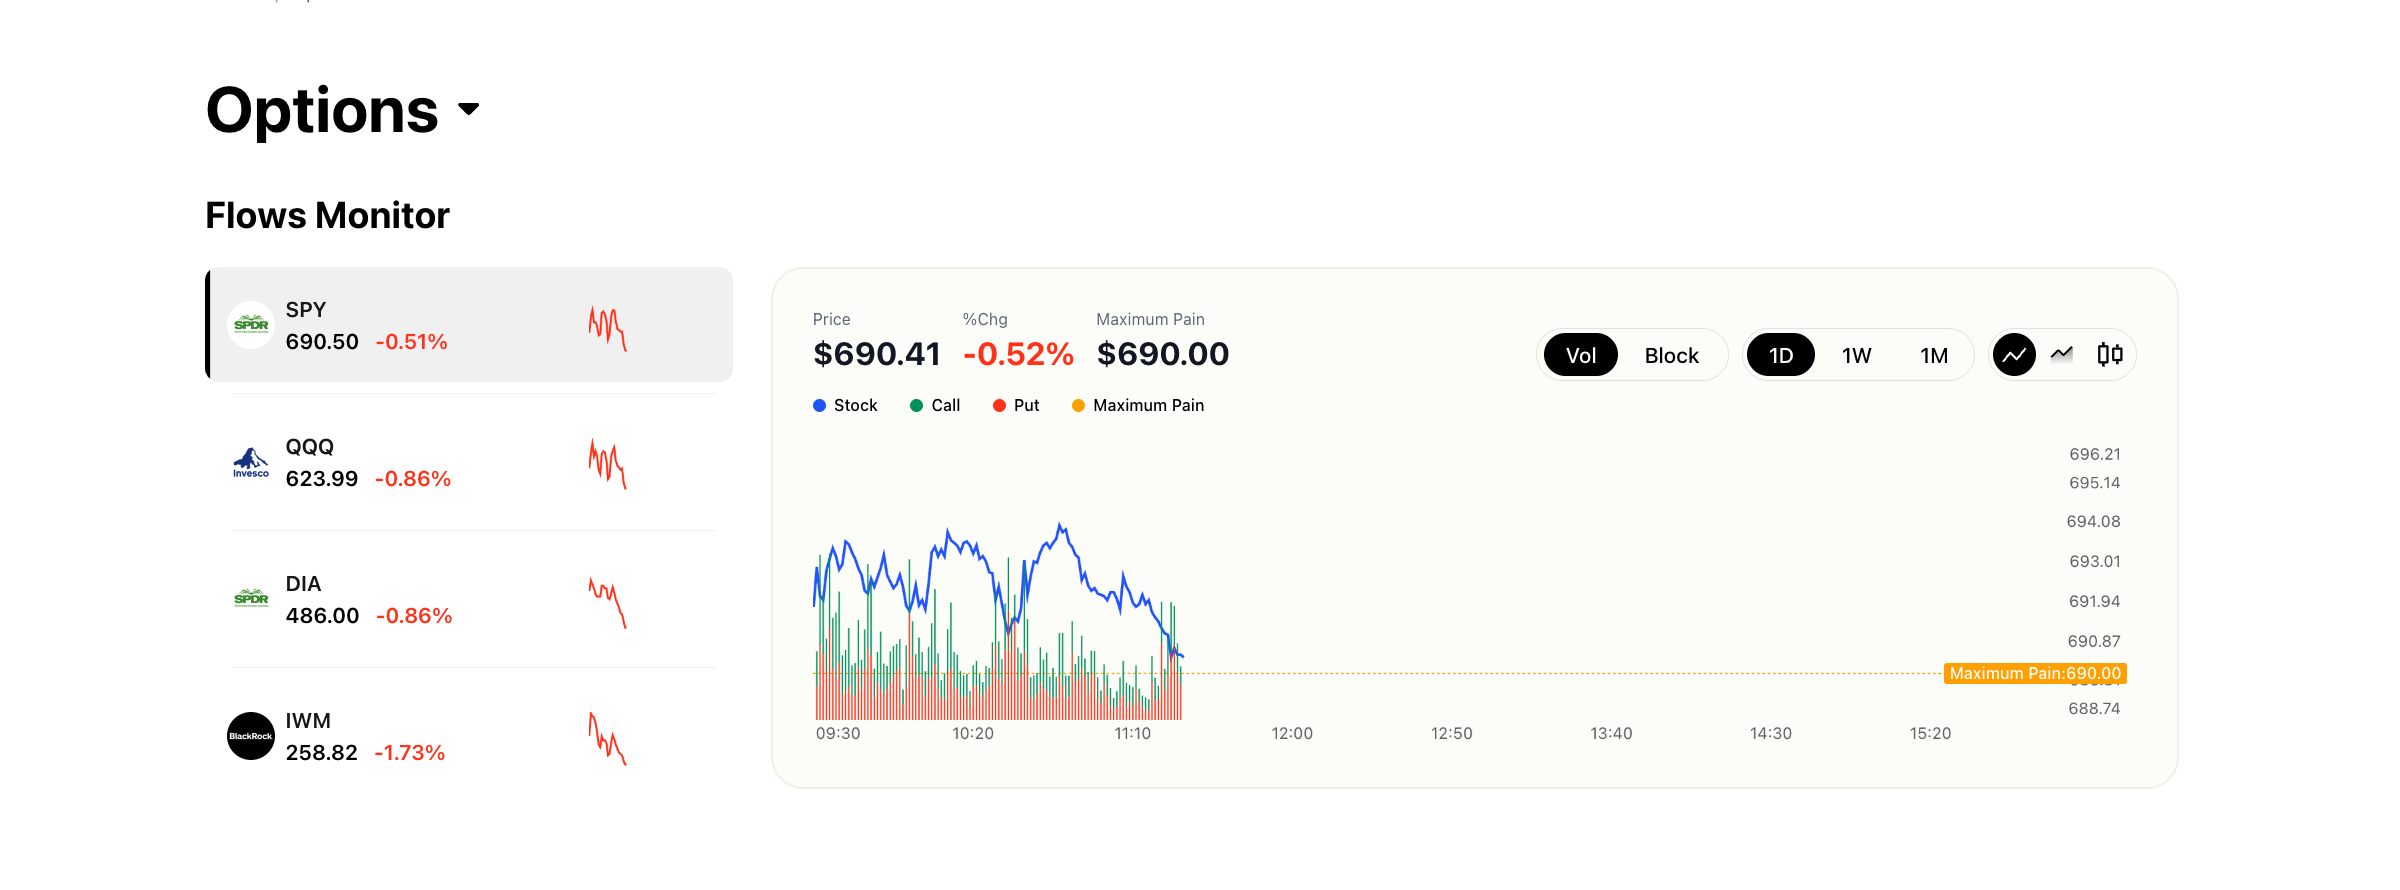
Left Sidebar
A vertical list of pinned index ETFs -- SPY, QQQ, DIA, and IWM -- is displayed along the left side. Each entry shows:
- Ticker symbol
- Current price
- Percentage change for the day
- A small sparkline chart showing intraday price movement
Click any ticker in the sidebar to load its flow data into the main chart.
Main Chart
The central chart displays an intraday view with three data series overlaid:
- Stock price (blue line) -- The underlying's price movement throughout the day
- Call volume (green) -- Aggregated call option volume
- Put volume (red) -- Aggregated put option volume
- Maximum Pain (orange) -- The strike price at which the most options contracts would expire worthless, causing the maximum financial loss for option holders
Above the chart, you will see key data values: the current Price, % Change, and Maximum Pain value for the selected ticker.
Chart Controls
A set of controls above or near the chart lets you customize the view:
- Vol / Block toggle -- Switch between showing all volume and showing only block trades
- Timeframe selector -- Choose from 1D (one day), 1W (one week), or 1M (one month)
- Chart type -- Toggle between line chart and candlestick chart
These controls allow you to zoom in on intraday flow or zoom out to see weekly or monthly trends.
Option Lab
Below the Flows Monitor, the Option Lab section provides curated editorial content focused on options.
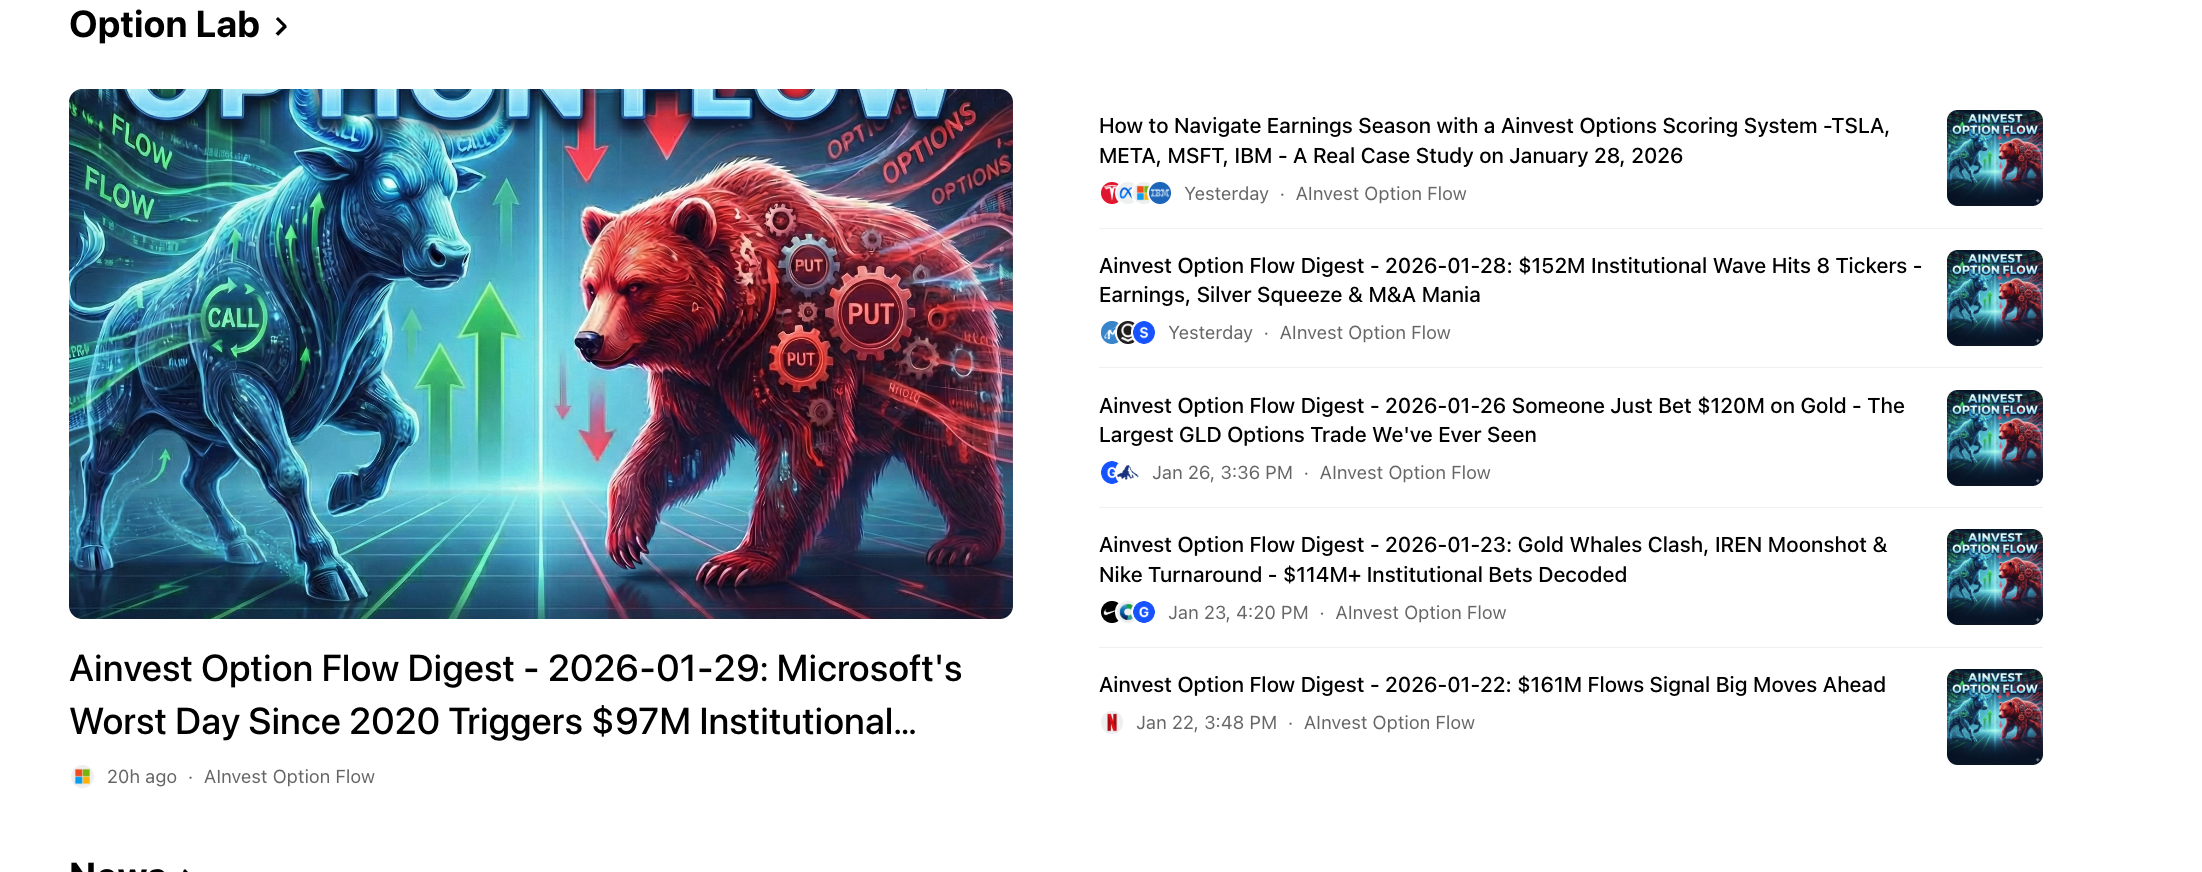
Featured Article
A large card with a thumbnail image highlights the latest Option Flow Digest -- a daily newsletter written by Ainvest's editorial team. Each digest analyzes notable institutional trades, unusual flow patterns, and key takeaways from the day's options market.
Recent Articles
Below the featured card, a list of recent articles is displayed. These include:
- Daily Flow Digests -- Recurring daily newsletters breaking down institutional activity
- Option Market News -- Articles covering broader options market developments, earnings-related flow, and macro-driven positioning
Each entry shows a headline and publication date. Click any article to read the full piece.
0DTE Rankings
The 0DTE Rankings section lists zero-days-to-expiration options -- contracts expiring on the current trading day. These are among the most actively traded and volatile options in the market.
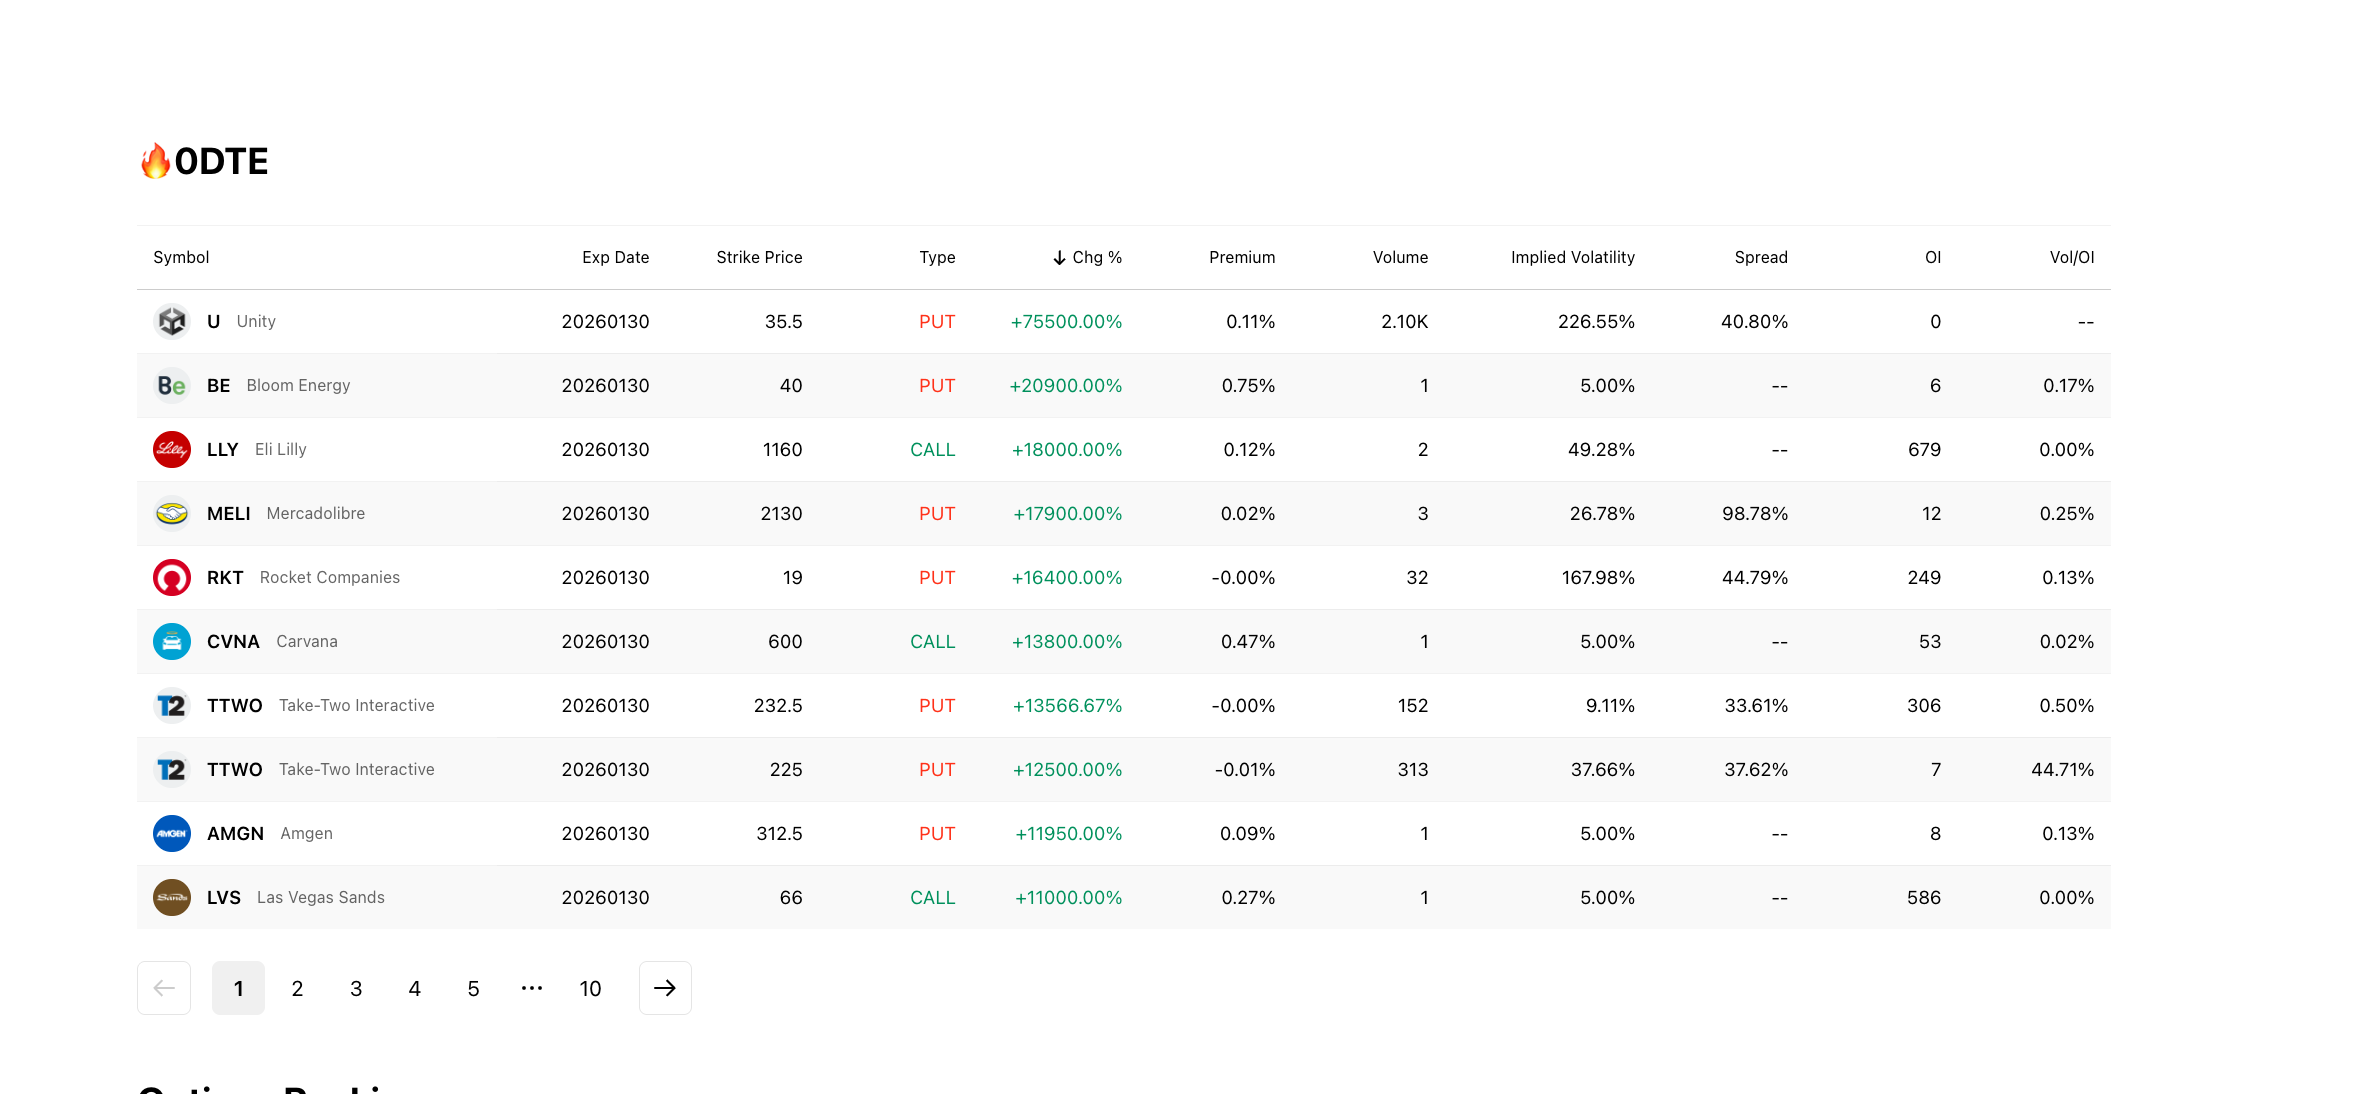
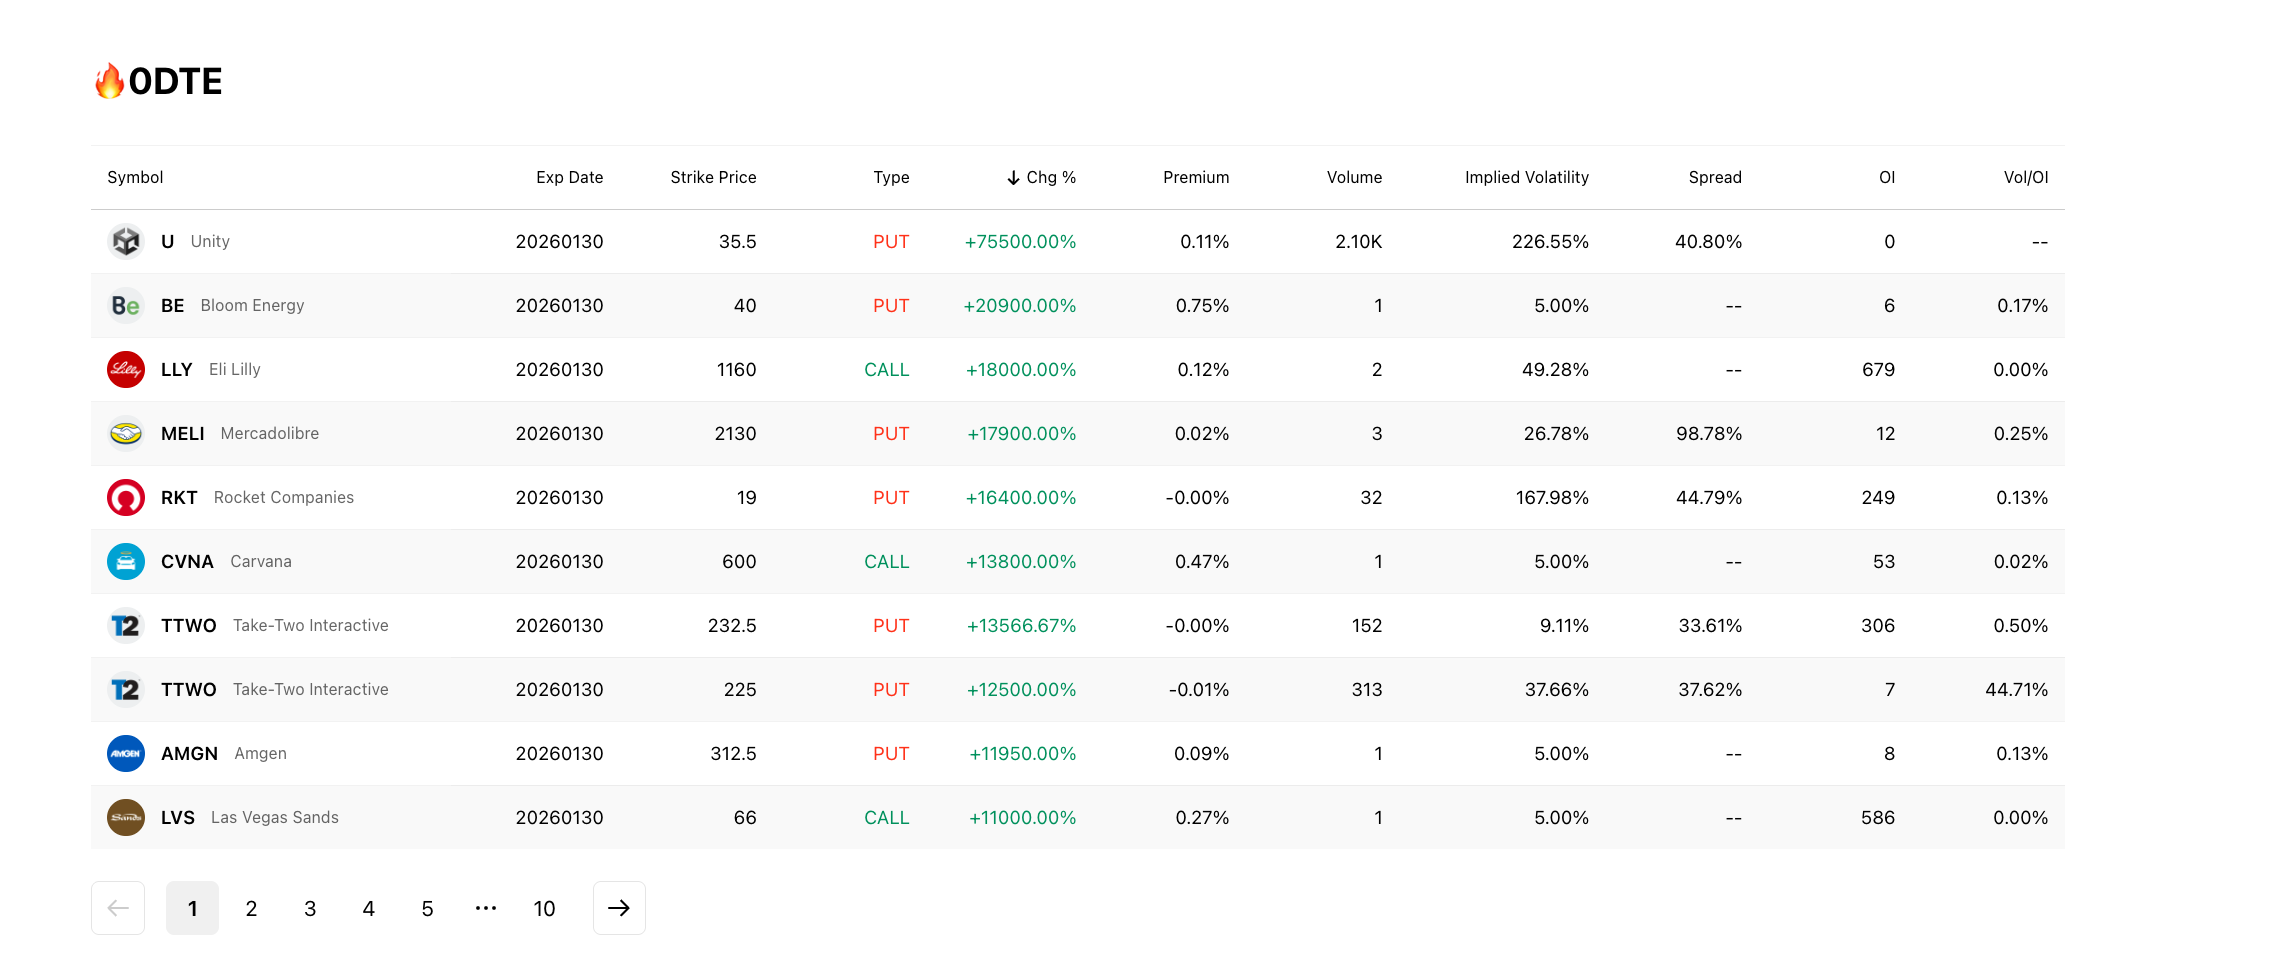
Table Columns
The table displays the following columns for each contract:
| Column | Description |
|---|---|
| Symbol | Underlying ticker |
| Exp Date | Expiration date (today's date for 0DTE) |
| Strike Price | The strike price of the contract |
| Type | Call (green) or Put (red) |
| Chg% | Percentage price change |
| Premium | Current option premium |
| Volume | Number of contracts traded |
| Implied Volatility | The IV of the contract |
| Spread | Bid-ask spread |
| OI | Open interest |
| Vol/OI | Volume-to-open-interest ratio |
By default, the table is sorted by Chg% in descending order, surfacing the contracts with the largest price moves. The table is paginated with 10 entries per page.
Options Rankings
The Options Rankings section at the bottom of the page provides broader market-wide rankings beyond 0DTE.
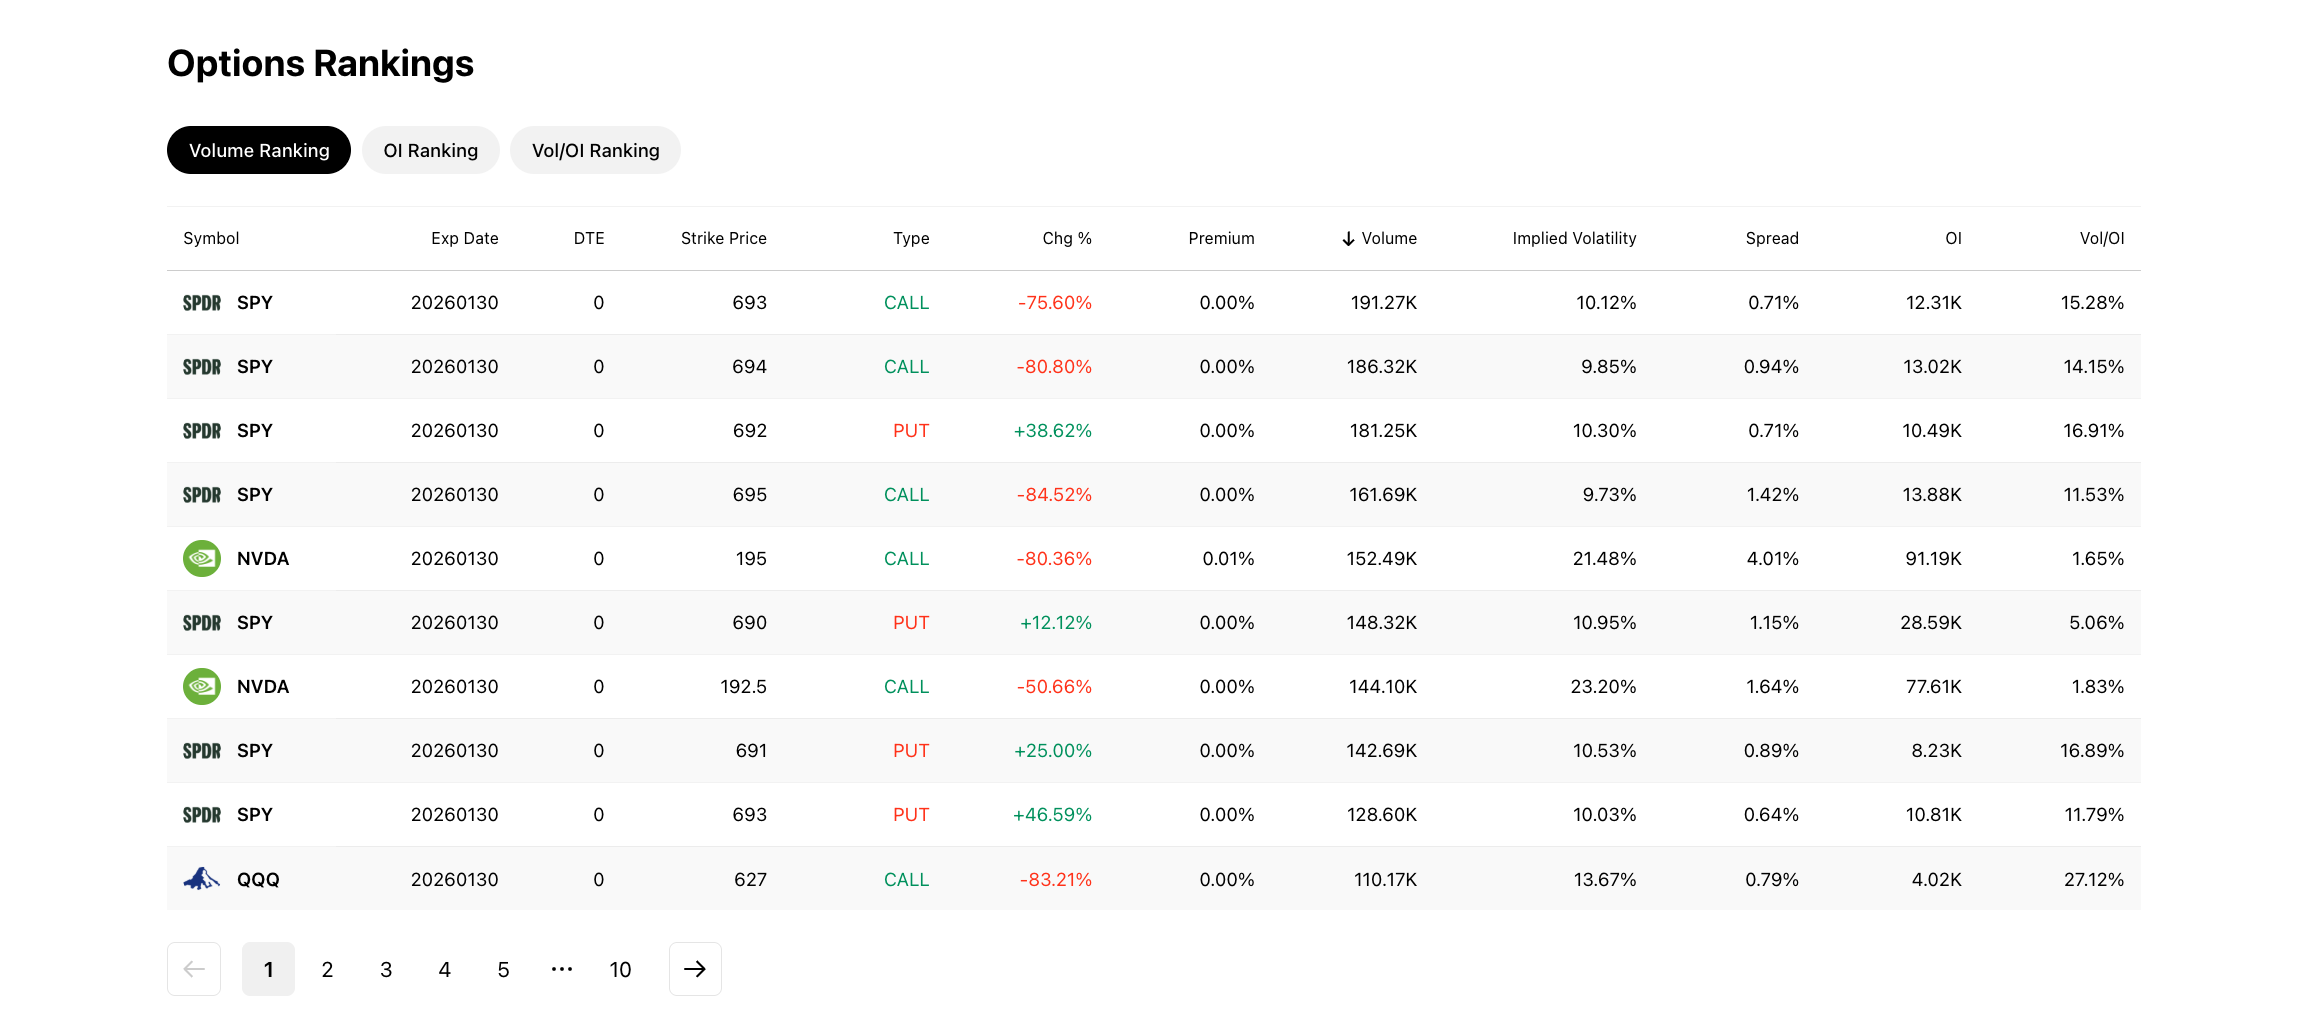
Ranking Tabs
Three tabs let you switch between different ranking criteria:
- Volume Ranking -- Options sorted by total volume traded
- OI Ranking -- Options sorted by open interest
- Vol/OI Ranking -- Options sorted by the ratio of volume to open interest, which can highlight contracts with unusual activity relative to their outstanding positions
Table Columns
Each ranking tab displays a table with the following columns:
| Column | Description |
|---|---|
| Symbol | Underlying ticker |
| Exp Date | Contract expiration date |
| DTE | Days to expiration |
| Strike Price | Strike price |
| Type | Call or Put |
| Chg% | Percentage price change |
| Premium | Current option premium |
| % Volume | Volume as a percentage |
| Implied Volatility | IV of the contract |
| Spread | Bid-ask spread |
| OI | Open interest |
| Vol/OI | Volume-to-open-interest ratio |
All ranking tabs are paginated, allowing you to browse through the full list of ranked contracts.
Try it on Ainvest: Open the Options Overview — see the full web dashboard with live data.
See Also
- Feature Finder -- Quick-reference table for locating any feature
- Mobile Options Section -- The mobile equivalent of this page
- Navigating Options on Ainvest -- Full navigation orientation for web and mobile