The Ainvest mobile app provides a full options experience optimized for on-the-go analysis. This article walks through every screen and feature available in the mobile options section.
Accessing Options
From the bottom navigation bar, tap the Market tab. At the top of the Market screen, a horizontal tab bar displays: Stocks, ETFs, Crypto, Options, Bonds. Tap Options to enter the options section.
Once inside, you will see three sub-tabs across the top of the section: Market, Trade Idea, and 0DTE.
Market Tab (Default)
The Market tab is the default view when you enter the Options section. It combines several components into a single scrollable screen.
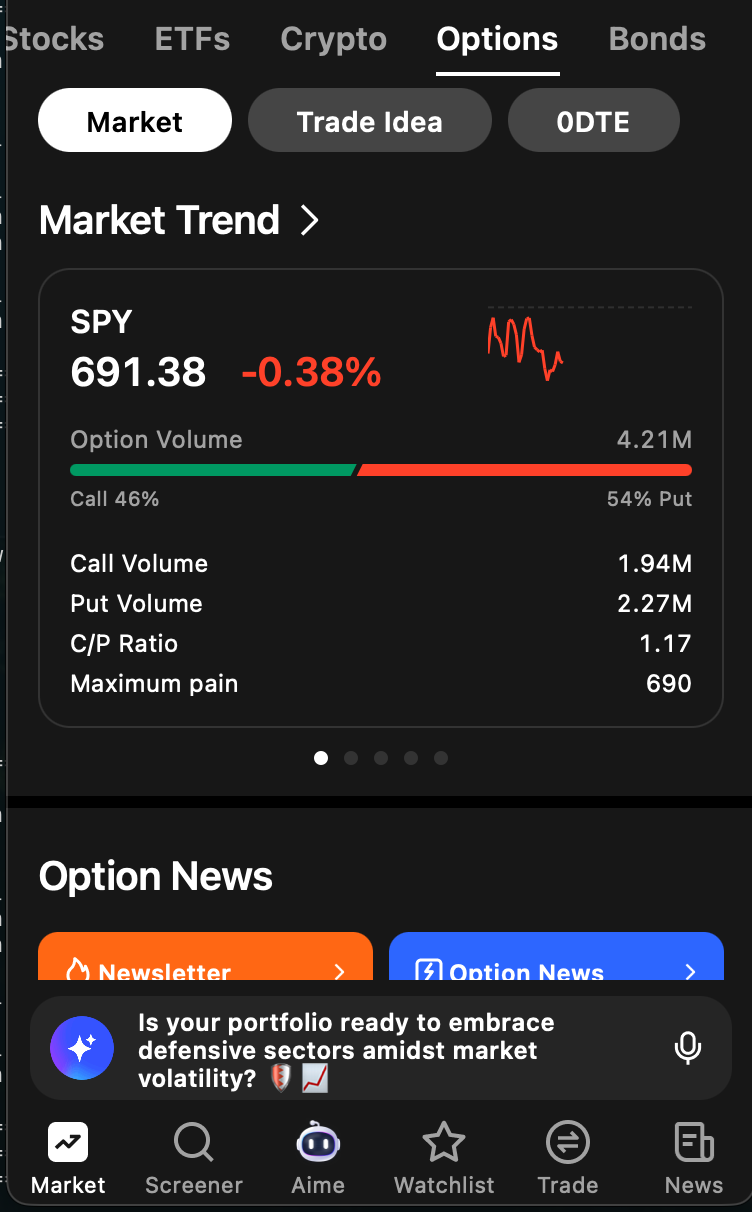
Market Trend
At the top of the Market tab, a row of swipeable cards displays real-time data for major index ETFs: SPY, QQQ, DIA, and IWM. Each card includes:
- Price and % change -- Current price with daily percentage change
- Sparkline -- A small intraday price chart
- Option Volume -- Total option contracts traded
- Call/Put volume bar -- A horizontal bar split into green (calls) and red (puts) showing the relative proportion of each
- Call Volume -- Total call contracts traded
- Put Volume -- Total put contracts traded
- C/P Ratio -- Call-to-put ratio for the day
- Maximum Pain -- The strike price at which the greatest number of contracts expire worthless
Swipe left or right to cycle through the pinned tickers.
Option News
Below Market Trend, two entry points provide access to editorial content:
- Newsletter (orange card) -- Links to the latest daily Option Flow Digest, a recurring newsletter analyzing institutional flow and notable trades. Shows the latest headline with a ticker icon and price.
- Option News (blue card) -- Links to option-related news articles covering market developments, earnings flow, and macro positioning. Also shows the latest headline with ticker icon and price.
Tap either card to browse the full list of articles.
Block Flows
Scrolling further down reveals the Block Flows section. This is a simplified view of market-wide block trade activity. Each row displays:
- Symbol -- The underlying ticker
- Volume -- Number of contracts in the block trade
- Turnover -- Dollar value of the transaction
This is a condensed version of the web's full Block Monitor page. It does not include the advanced filtering available on web.
Options Ranking
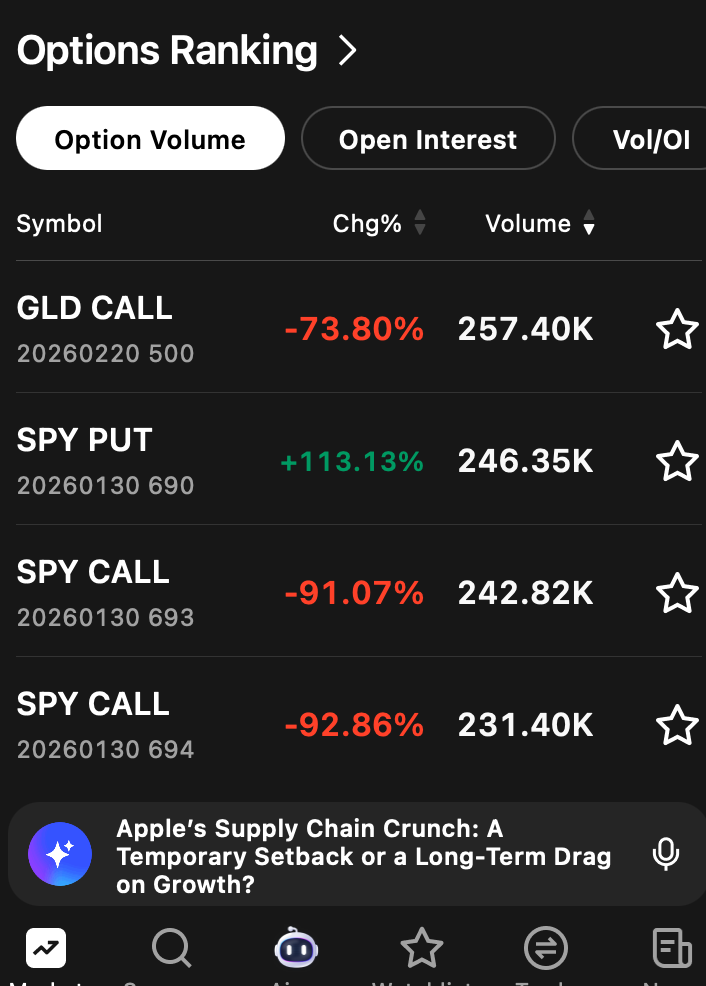
At the bottom of the Market tab, the Options Ranking section lists options contracts sorted by key metrics. You can toggle between three sort modes:
- Option Volume -- Sorted by total contracts traded
- Open Interest -- Sorted by outstanding open interest
- Vol/OI -- Sorted by volume-to-open-interest ratio
Each row shows the ticker symbol with its expiration date and strike price, percentage change (Chg%), volume, and a star icon to add the contract to your watchlist.
Trade Idea Tab
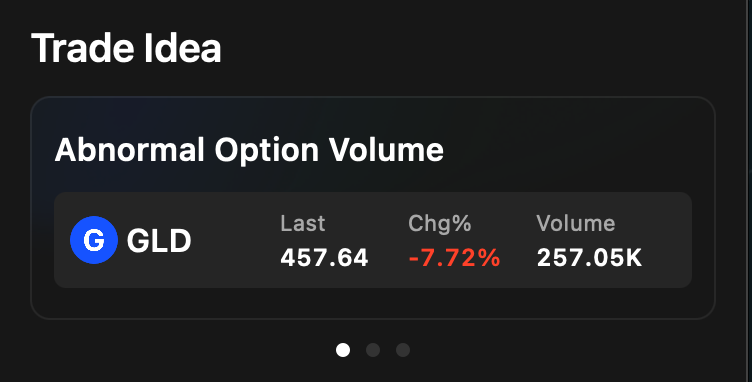
Tap the Trade Idea tab to view contracts flagged for abnormal option volume -- situations where trading volume has spiked significantly relative to normal levels.
The view presents swipeable cards, each showing:
- Ticker -- The underlying symbol
- Last price -- Most recent trade price
- Chg% -- Daily percentage change
- Volume -- Current option volume
This tab is designed to surface potential trading opportunities driven by unusual activity. Swipe through the cards to browse the latest flagged contracts.
0DTE Tab
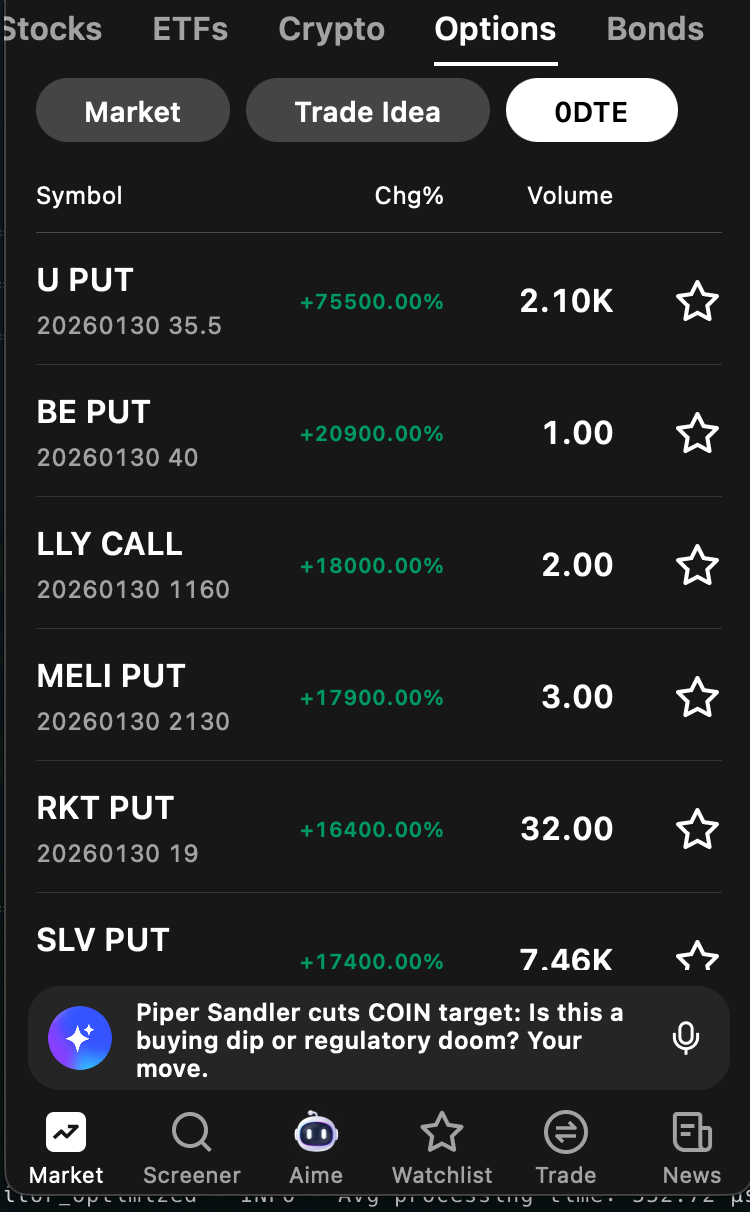
The 0DTE tab displays zero-days-to-expiration options rankings in a mobile-optimized format. The data matches what is shown on the web's 0DTE Rankings section.
Each row shows:
- Symbol -- Underlying ticker
- Expiration -- Today's date
- Strike -- Strike price of the contract
- Chg% -- Percentage price change
- Volume -- Contracts traded
- Star icon -- Tap to add the contract to your watchlist
Scroll through the list to find the most actively moving 0DTE contracts.
Ticker Page -- Options Tab
Tapping any ticker anywhere in the app opens its ticker page. From there, tap the Options tab to access per-ticker options tools. The Options tab contains three sub-tabs: Chain, Analysis, and Unusual Monitor.
Chain
The Chain sub-tab displays the full option chain for the selected ticker.
- Expiration date tabs -- Horizontal tabs along the top let you select an expiration date
- All / Call / Put filter -- Toggle to show all contracts, calls only, or puts only
- Strike prices -- Each row shows a strike price along with the bid, ask, and last traded price for that contract
Scroll through the chain to find the specific contract you are interested in.
Analysis
The Analysis sub-tab provides visual and quantitative tools for understanding the options landscape of a ticker. Scroll down through the following components:
- Volume and Open Interest views -- Toggle between Volume and OI to see aggregated data, with filters for expiration and strike
- Call/Put ITM/OTM breakdown table -- A table breaking down call and put volume by in-the-money (ITM) and out-of-the-money (OTM) status
- Strike Price distribution bar chart -- A horizontal bar chart showing how volume or open interest is distributed across strike prices. This feature is mobile-only and is not available on web.
- Volatility Smile chart -- Plots implied volatility against strike price for a given expiration, showing how IV varies across strikes
- Volatility Term Structure chart -- Plots implied volatility against expiration date at a given strike, showing how IV changes over time
Unusual Monitor
The Unusual Monitor sub-tab surfaces atypical trading activity for the selected ticker.
- Trading Summary -- A bar at the top of the view showing aggregated call volume versus put volume, giving you an immediate sense of directional bias
- Unusual trade feed -- A chronological list of individual unusual trades. Each entry includes:
- Buy/Sell indicator -- Whether the trade was a buy or sell
- Price -- The price at which the trade executed
- Size -- Number of contracts
- DTE -- Days to expiration for the contract
- Transaction value -- Dollar value of the trade
- Tags -- Descriptive labels such as
floor,singleLeg,ITM, orOTMproviding additional context about the trade
This feed helps you spot when large or unusual trades are hitting the tape for a specific ticker.
Try it on Ainvest: Download the Ainvest app or visit the web platform to explore all options tools.
See Also
- Options Overview Page (Web) -- The web equivalent of this mobile section
- Feature Finder -- Quick-reference table for locating any feature on web or mobile
- Navigating Options on Ainvest -- Full navigation orientation for both platforms