Volatility analysis is central to options trading. Ainvest provides tools for visualizing implied volatility (IV) patterns across strikes and expirations, helping you understand how the market prices risk and expectation into every options contract.
Why Volatility Analysis Matters
Implied volatility is one of the most critical inputs in options pricing. Unlike historical volatility, which looks backward at past price movements, IV is forward-looking -- it reflects the market's consensus estimate of how much a stock will move before an option expires. Understanding IV structure helps you:
- Identify mispriced options. When IV at a particular strike or expiration deviates from its typical pattern, it can signal a trading opportunity.
- Gauge market sentiment. Elevated IV on out-of-the-money puts, for example, indicates that traders are paying up for downside protection -- a sign of cautious sentiment.
- Time entries and exits around volatility events. Earnings announcements, economic data releases, and other catalysts cause predictable IV patterns. Knowing where IV stands relative to these events helps you decide when to buy or sell premium.
Ainvest Volatility Tools
Ainvest offers two volatility visualization tools, each designed to reveal a different dimension of the IV surface:
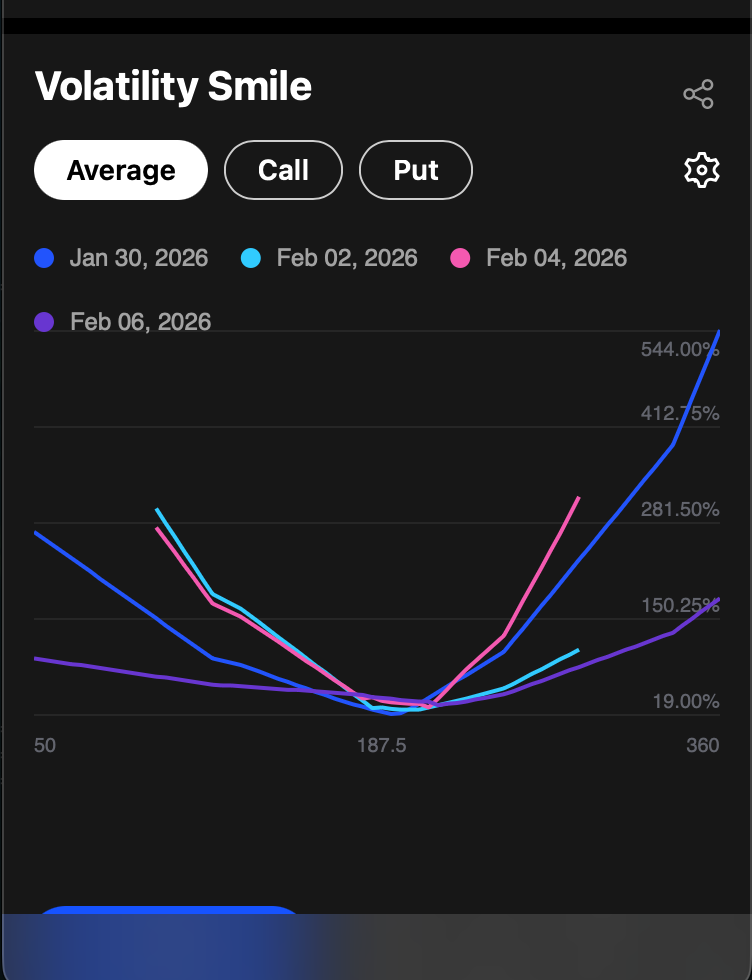
Volatility Smile -- Plots IV against strike prices for selected expirations. This view reveals how the market prices risk at different price levels, showing whether out-of-the-money puts or calls carry a higher risk premium.
Volatility Term Structure -- Plots IV against expiration dates for selected strikes. This view reveals how the market prices risk over time, showing whether near-term or long-term uncertainty is driving options premiums.
Together, these two charts give you a comprehensive picture of the implied volatility surface -- the three-dimensional relationship between IV, strike price, and time to expiration.
Where to Find Volatility Tools
On the web: Navigate to https://www.ainvest.com/etfs/ARCA-SPY/options/ and select the Volatility tab.
On mobile: Open the ticker page, tap the Options tab, then select Analysis. Scroll down to find the volatility charts.
Try it on Ainvest: View volatility charts — analyze implied volatility across strikes and expirations with live data.
Next Steps
- Volatility Smile -- Learn how to read and interpret IV across strike prices
- Volatility Term Structure -- Learn how to read and interpret IV across expiration dates
- Implied Volatility Explained -- A foundational guide to what IV is and how it works