What Is Flow Monitoring?
Flow monitoring is the practice of tracking real-time options trading activity to identify institutional and unusual order flow. Every options trade that executes on a public exchange leaves a footprint — and by aggregating and analyzing those footprints, traders can gain insight into how large market participants are positioning themselves.
Institutional investors, hedge funds, and market makers often trade in sizes and patterns that stand out from ordinary retail activity. When a fund places a multi-million-dollar directional bet through the options market, that trade is visible in the flow data. Flow monitoring tools surface these signals so that retail traders can observe what the so-called "smart money" is doing and factor that information into their own analysis.
Why Flow Monitoring Matters
Options flow data matters because large block trades and unusual activity can signal informed positioning. Institutions typically have dedicated research teams, proprietary models, and access to information channels that individual traders do not. While no single trade guarantees a future price move, patterns of large, directional options activity have historically preceded significant moves in the underlying stock or index.
By watching the flow, you can:
- Identify tickers attracting outsized institutional attention before the move shows up on a stock chart.
- Gauge market-wide sentiment by observing whether aggregate call or put volume is dominating.
- Spot hedging activity that may indicate large players are protecting existing positions against downside risk.
- Detect speculative bets on near-term catalysts such as earnings, FDA decisions, or macroeconomic events.
Ainvest Flow Monitoring Tools
Ainvest offers three complementary tools that work together to give you a complete picture of options flow:
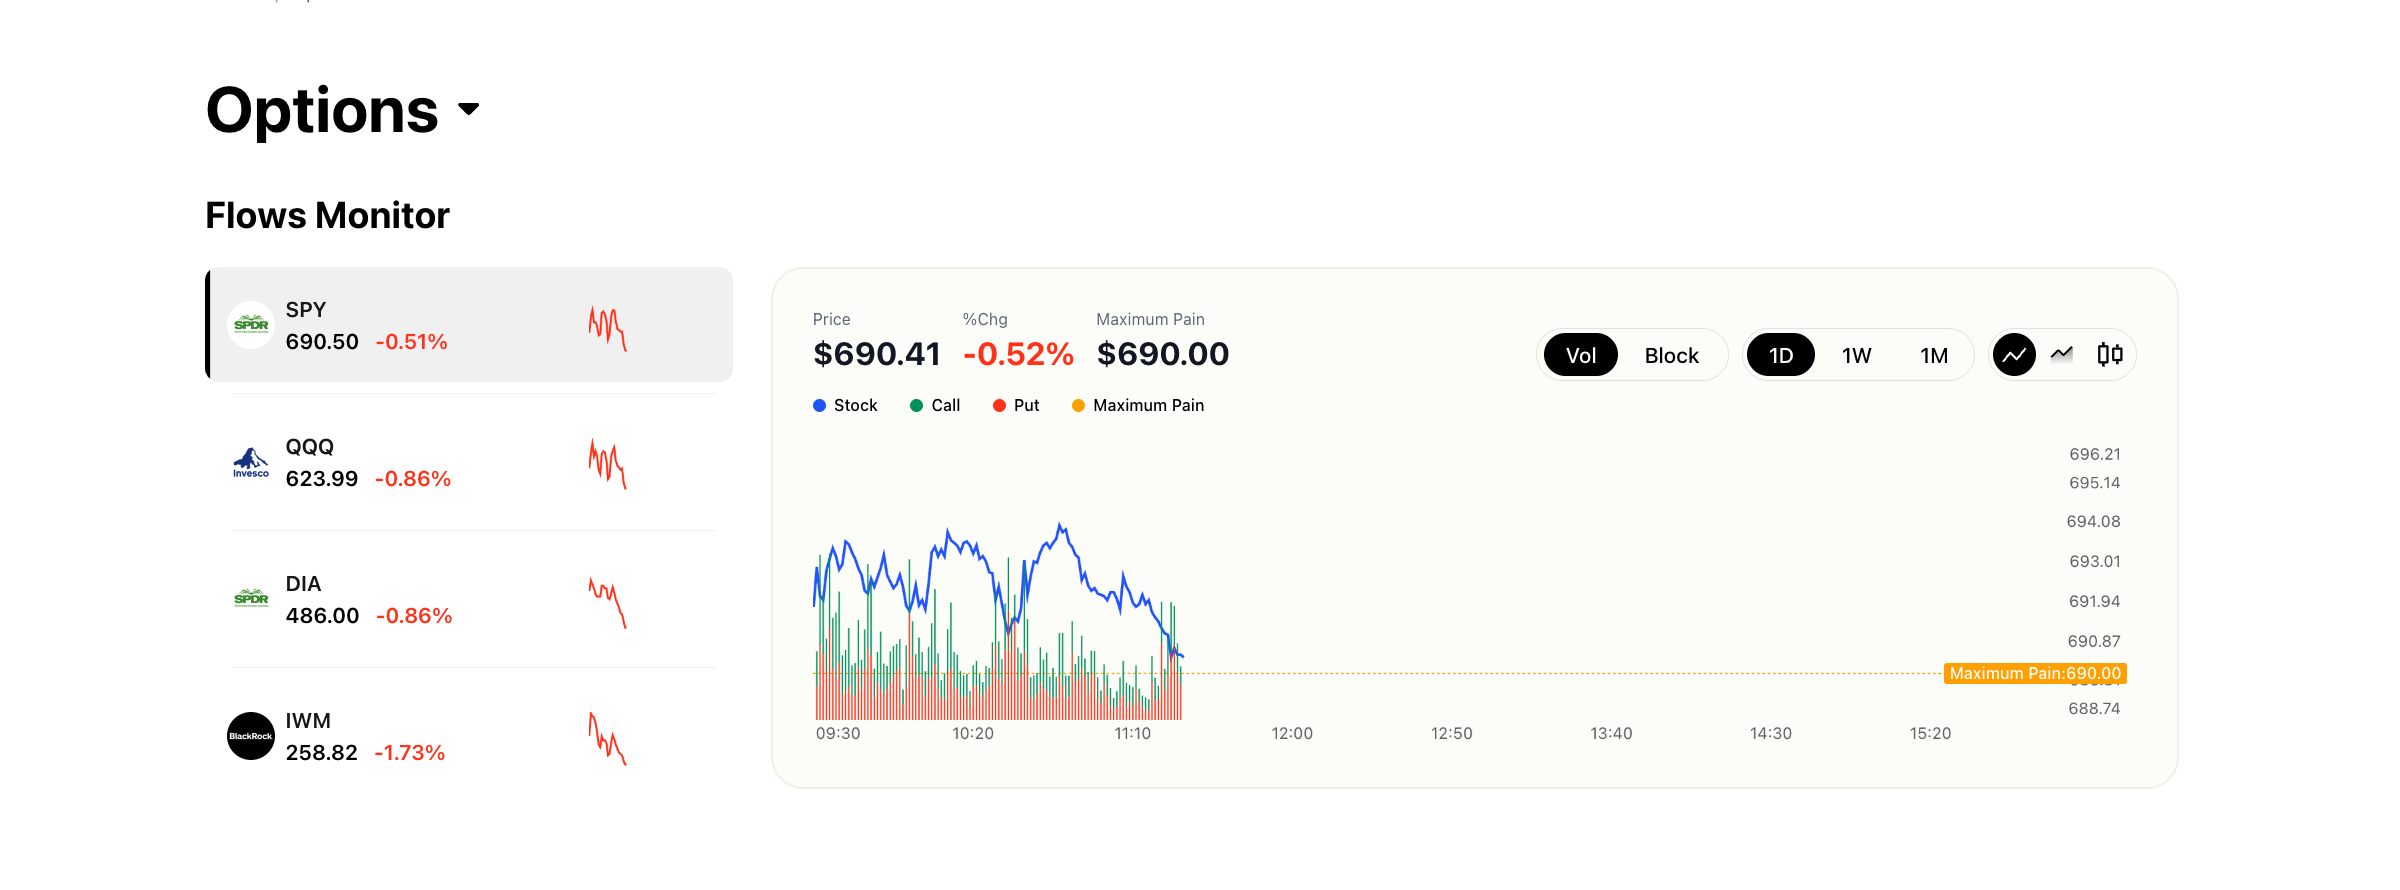
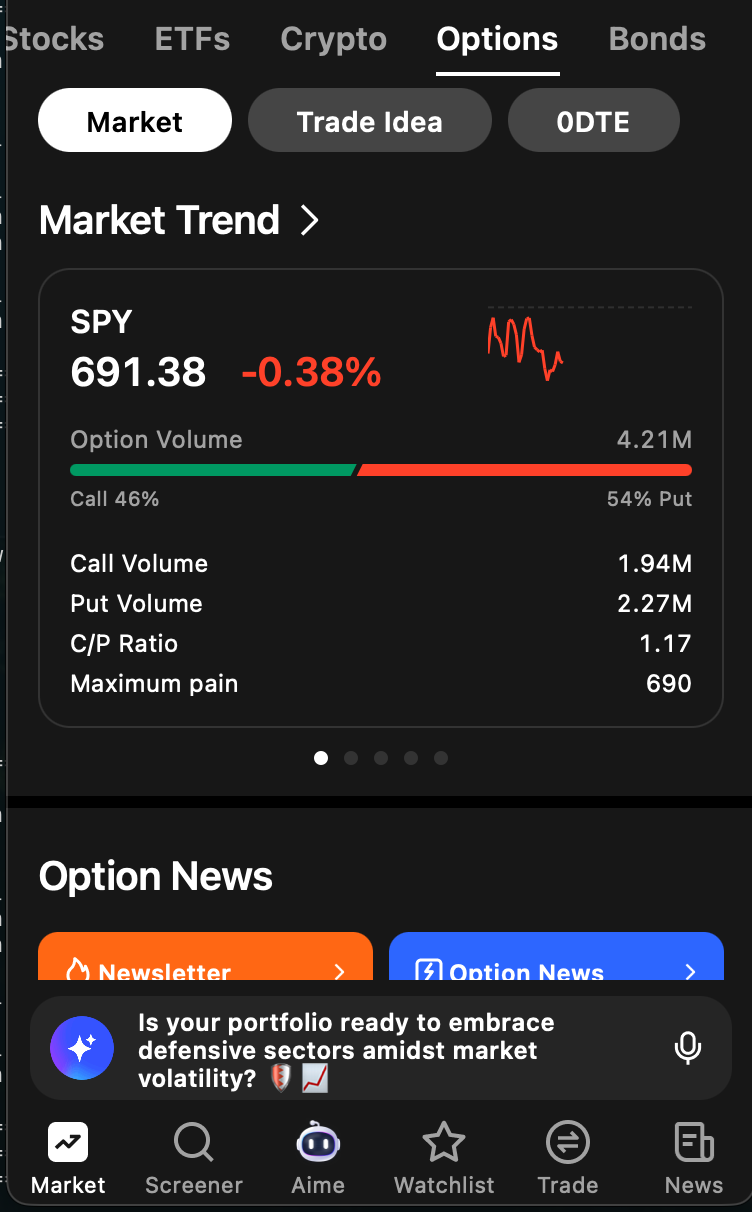
- Flows Monitor Chart — An intraday visualization of aggregate call and put volume overlaid with the underlying asset's price action and maximum pain level. This tool gives you the macro picture: how is total options volume shifting throughout the day, and how does it relate to price?
Block Monitor — A real-time feed of large individual block trades detected across the entire market. Advanced filters let you narrow by ticker, trade type, moneyness, and date range. This tool shows you the specific large trades happening market-wide.
Unusual Activity Monitor — A per-ticker feed of unusual trades that includes a trading summary (call vs. put volume breakdown) and a chronological list of individual transactions. This tool lets you zoom into a single stock and examine its unusual activity in detail.
How the Three Tools Complement Each Other
Think of these tools as three levels of zoom:
- The Flows Monitor Chart is the wide-angle lens. It shows aggregate volume trends and price action for major indices and individual tickers, helping you understand the overall flow landscape.
- The Block Monitor is the market-wide scanner. It surfaces the largest individual trades happening anywhere in the market, so you can discover which tickers are attracting institutional attention even if they are not on your watchlist.
- The Unusual Activity Monitor is the microscope. Once you have identified a ticker of interest — whether from the Block Monitor, the Flows Chart, or your own research — the Unusual Activity Monitor lets you examine every notable trade on that ticker, along with summary statistics.
Used together, these tools create a workflow: scan the broad market with the Flows Chart and Block Monitor, identify tickers of interest, then drill into each ticker with the Unusual Activity Monitor.
Quick Reference: Choosing the Right Flow Tool
| Your Goal | Best Tool |
|---|---|
| See overall call/put sentiment for a ticker | Flows Monitor Chart |
| Find the largest institutional trades across the market | Block Monitor |
| Investigate unusual positioning on a single ticker | Unusual Activity Monitor |
| Build a watchlist of tickers with institutional interest | Block Monitor → filter by size and direction |
| Confirm a thesis before entering a trade | Unusual Activity Monitor + Flows Monitor Chart |
| Monitor expiration-day activity and max pain dynamics | Flows Monitor Chart |
Try it on Ainvest: Open the Flows Monitor — track institutional options activity in real time.
Related Resources
- Understanding Block Trades — Learn how to interpret block trade data and apply it to your trading decisions.